Table Editor v24.1
Documentation and Troubleshooting Guide
Contents
- Introduction
- Overview
- Support
- Versions
- Prerequisites
- Setup and Configuration of the Visual
- Configuration Options
- Data Entry
- WebService
- Type
- Windows Authentication
- Connection
- Customer
- Domain
- Source Table
- Image URL (Displayed)
- Image Link
- Image Position
- Enable Delete
- Enable Editing
- Details Editing
- Enable Filtering
- Enable Insert
- Enable Import
- Enable Paging
- Enable Set All
- Enable Sorting
- Enable Totals
- Enable Page Totals
- Enable Section Totals
- Enable Duplicating
- Enable Row Selection
- Auto Save
- Instant Save
- Instant Edit
- Auto Refresh
- Saving Complete Message
- Save Read Only Values
- Input Culture
- Date Format
- Layout
- Single Transaction
- Filters Remain After Save
- Column Properties
- Visible
- Column Type
- Title
- Show Total
- Computed Value
- Default Value
- Display Default Value
- Connection Between Computed Value & Default Value
- Read Only
- Exclude Column from Save
- Wrap Text
- Width
- Required
- Alignment
- Section
- Conditional Formatting Source Column
- Format
- Conditional Formatting
- Primary Font Color
- Primary Background Color
- Secondary Font Color
- Secondary Background Color
- Parent Column
- Write Security Column
- Style
- Cell Padding
- Page Size
- Always Insert Row
- Minimum Row Height
- Controls on the Left
- Table Transparent
- Header/Footer URL
- Dynamic Header/Footer Content
- Take Footer Style Setting from Header
- Apply Column Alignment to Header
- Display Column Name in Section Header
- Text Area Display Line Breaks
- Get Dropdown Values Retry Count
- Get Dropdown Values Retry Delay
- Wrap Header Text
- External Stylesheet
- User Cases
- Copy-Paste in Table Editor
- Performance Optimization
- Custom Validation
- Auditing
- Write-back Security Controlled within the Visual
- Write-back Security Leveraging SQL Server Row Level Security Feature or Triggers
- Image Columns with Tooltips
- Image Link Mode
- Master/Detail View with Bookmarks
- Storing Image in Columns
- Troubleshooting
- Debug
- Data Entry
Introduction
This document describes Power ON write-back capable tool, Visual Table Editor (VTE). The product is a custom visual developed for Microsoft Power BI, that enhances the user experience by enabling end-users to make permanent changes on data – aka write-back – enriching it with text input controls (like how you can see on modern html pages, e.g.: date pickers, dropdowns, rich text) as well besides the traditional look and see feeling.
Here you will find a detailed overview of Table Editor. You will learn
- how to use it in your reports together with some common use-case implementations,
- how to configure it properly,
- what the pitfalls are you might encounter and how to overcome them.
Audience
This document is intended both for technicians (developers, DBAs, BI professionals) who are aware of the depths of SQL Server, SSAS Tabular models, Azure Services and Power BI, but also users who mostly focus on building and preparing reports using Power BI Desktop.
Contact Us
If anything is unclear or you wish to chat with one of our technical resources, please submit a ticket: https://support.poweronbi.com
Overview
VTE lets users edit any type of row-level information in Power BI. Most typical use case is managing dimension type data (like customers, products, etc.) – adding or removing records, editing existing members, changing attributes – as well as performing simple data entry workloads, or adding comments to existing fact table records. One can consider this visual as a replacement for an existing, simple form-like application, designed for master data or dimension data management.
VTE offers the following built-in features and components:
- Writing back values to the underlying data source
- Date Time picker for DATETIME data type columns
- Check Box control for BIT data type columns
- Dropdown list (called Selection) control for replacing key with values. For instance, instead of showing the Customer ID you can select the Customer Name, meanwhile saving the key back to the underlying table
- Search box that acts like an auto complete field for the most used values
- Multi-line text box
- Supports copy and paste selected cells to / from VTE
- Paging, sorting
- Conditional formatting for numeric type columns
- Rich Text display for Text Area type columns
- In the case of an Excel Export (built-in Power BI feature), dataset can be exported up to 150.000 rows, not just the first .000.
- … and many more.
It is worth describing at a high level how write-back works for Tabular Models. Depending on your data source (SSAS In-Memory, SSAS Direct Query, or SQL only) Power ON write-back service performs the following operations:
- Captures the modified value and the user context, determines what T-SQL statements should be executed based on the change and the structure of the model
- Executes the compiled T-SQL statement against the underlying data source to save the modifications
- In the case of SSAS in-memory models it will reprocess the table. (You will find suggestions on how to improve performance later in this document.)
- Initiates a refresh on the visual so, that the changes will appear in the report.
Support
Check out Power ON Knowledge Base articles at: https://support.poweronbi.com under Visual Planner for common use cases, tips, troubleshooting tools.
Please note that to access the articles, you need to register on the site. It is advised, as you will be able to submit tickets if you encounter any difficulties or issues, so that our support team can give you the best service. You can also email us at: vizsupport@poweronbi.com
Versions
This document describes the latest version of Visual Table Editor; however, you can use the previous ones as well as they are included in the setup kit, but keep in mind that some of the features detailed here are not available in older versions.
The most recent visual is tableEditor v2.10.pbiviz.
How can you download the different versions?
- Register at store.poweronbi.com site with the same domain name you have registered originally
- After login:
- Click on Visuals
- You can find our available write-back capable visuals and their different versions.
- Pick the preferable version of Table Editor and click on Download
- You can even download its Release notes, if you like.
Prerequisites
Write-back Service
You must have a working and configured write-back service (PPWebService) installed in your environment. If that is set, to build a report, first you must import the custom visual - the tableEditor v_latestVersion.pbiviz file into your Power BI Desktop instance. Naturally, you need to do that for each report in which you want to use the Table Editor. The visual will be stored in the report itself, so other people will also be able to use the write-back capabilities if they open it. In the case of PowerBI cloud services, there is an option to store the custom visual in a centralized repository for easier management. You can find more information on this URL: https://docs.microsoft.com/en-us/power-bi/developer/visuals/power-bi-custom-visuals-organization
The legacy version of the visual can be found in your installation folder under Resources\PPWebService in the VPDemo.zip archive file.
Also, VTE can be converted from other Power BI visuals, like other custom visuals in Power BI.
Before you begin, make sure that you have a properly configured write-back service (PPWebService) that is accessible from the point of the Report Server.
For more information about configuring the PPWebService, check out Power ON Knowledge Base articles at: https://support.poweronbi.com under Visual Planner – Write-Back Service for more details.
To access the articles, you need to register on the site. It is advised, as you will be able to submit tickets if you encounter any difficulties or issues so that our support team can give you the best service.
In the case of on-premises installations or virtual machines hosted in the cloud make sure that your Power BI Report Server can access the host IIS machine of the PPWebService.
In the case of Azure, the Web Applications are accessible by default. The webservice must have a designated connection string configured for the data source in the web.config connectionStrings section that is pointing to:
- In the case of SSAS models: the used SSAS Cube
- In the case of SQL only models: the used SQL database.
The web.config file can be found under the WWWRoot folder.
Connections to the data sources should be configured by your IT team. Please refer to the following article in our Knowledge Base on how to add ones at:
https://support.poweronbi.com/portal/kb/articles/how-to-add-a-new-data-source-for-write-back
You can find examples of valid connection strings for different data sources at:
https://www.connectionstrings.com/
The PPWebservice Service Account - used in the connection string - must have the following permissions:
- In the case of SSAS models: administration rights on the cube, plus data reader and data write roles on the underlying data source database of the cube.
- In the case of SQL only models: data reader and data write roles on the SQL database.
The end users (or the user / Active Directory group they are in) must have:
- In the case of SSAS models: data reader membership.
- In the case of SQL only models: data reader role.
In case of impersonation enabled, the end users must have data writer role.
VPService Visual
The VPService is a helper visual which establishes the connection between our newest visuals and the write-back service.
The benefits of this solution:
- faster release processes: switching from one version to another is much faster, which results in quicker support from our side (e.g.: in the case of implementing new features)
- You can change between the versions of the visuals easily.
The functions of VPService:
- Saves the changes
- Saves the comments (e.g.: in Data Entry Matrix visual)
- Sends the user information
- Opens the pop-up windows (e.g.: in Table Editor visual)
Warning Message
This warning message can be seen, when
- the report is in Edit mode,
- the user is building the report in PowerBI Desktop,
- the report is in Reading View mode and the user tries to save the changes and there is no VPService connection OR the URL of VPService is not exactly the same as in VTE (has to consider the case sensitivity too).
- This applies to all VPService based visuals (e.g.: version > TE v2.7.23, DEMx v4.x, PowerGantt visuals).
How to Configure VPService Visual
After importing the visual you can see its icon () under the built-in visuals. You can check its version by right clicking on the icon and selecting ‘About’ in the menu. A pop-up window appears with the version information.
Add the VPService helper visual to your Table Editor related report.
Add an arbitrary field to VPService visual, e.g.: an ID.
The content of the [Web Service] » Url property must be exactly the same (case sensitive too!) as in Table Editor ([Data Entry] » Web Service)!
Updating from an Older Version of Table Editor to v2.10
- Download the newest version from the above URL.
- Pick a Table Editor related report and download its .pbix file from: [File] » 'Download the .pbix file'
- Rename the downloaded report to keep the original version and open it in PowerBI Desktop.
- Click on the three dots in Visualizations pane:
- Choose [Import a visual from a file] --> [Import]
- Find the downloaded visual file (tableEditor_v2.pbviz). Most probably it has been saved in your [Downloads] folder. Click on it to be selected. After the selection, its name will be seen in 'File name:', at the bottom of the pop-up window.
- Click on [Open]
- You will be notified about the successful import, so click on [OK].
- If you go above its icon, in its ToolTip you will see the same text: 'Power ON Table Editor v2'.
If you right click on them and choose 'About' from the appeared menu, a pop-up window will tell you everything about the visual. This is how you can check their version number.
Select the Table Editor visual in your report and click on that Power ON Table Editor v2 icon, which version is 2.10. The report's visual becomes the newer version, and all your previous settings remain the same.
Specific Details
The most important one is that the target table for the write-back must have a primary key defined with the followings to keep in mind:
- composite keys are not supported.
- in case of SSAS data source the primary key must be part of the SSAS model and visible for end users, and it must be added to the visual as a field.
- if there are any specific business rules for creating a key for a new record you either have to create your own custom trigger in your database to provide the new value during the operation. Or in case you can compute the key based on existing data visible in the model with DAX, you can use the Computed Column property (see Configuration Options – Column Properties chapter).
Limitations
As all custom visuals developed for Power BI, due to Microsoft policies, VTE also has the following limitations:
- Renaming editable columns and tables in the Power BI report is not supported. They must be the same as they are called in the used data source.
In the case of SSAS models, the names should be equal to the names of the entities (visible in your model or in your report Fields sections).
In the case of SQL data source, the names of the entities should be the same as they are in the SQL tables (e.g.: if your table in SQL is called Customer, it should NOT be called Customers in your report). This rule should also be applied to the names of the fields/columns. Column’s displayed header can be modified in the [Column properties] section of the visual.
- The characters ’.’ (dot) and [,],{,} and system reserved ones are not supported in table names. Dot can exist in schema names. If you have unsupported characters in your table name, we recommend creating a view on top over the table that complies with the required format and use that view when writing back.
- You cannot perform aggregations on the fields in the visual if you want to modify the value of that field. Fields must be set to Don’t summarize in the Visualizations » Fields » Values section, otherwise, you will not be able to change values in those columns on which you have aggregations defined. However, you can still display aggregated value in your visual, but you will not be able to modify those inputs.
- All custom visuals developed for PowerBI have a default limitation set by Microsoft which is that 000 records can be displayed at one time. If your underlying table has more rows, consider using slicers in your report so that you will edit only a subset of the data and have a seamless workflow.
- Write-back to measures is not supported by the VTE. Only row level data can be modified. If you want to change the values of measures use the Data Entry Matrix (DEMx) visual instead. VTE is intended to be used in cases when you want to modify descriptive, dimension type data.
- Columns that are used as a data source for Selection and Search box cannot have TEXT or NTEXT data types if you DO NOT use the SmartFilter technique (described in the Selection column type section under [Column properties]). If you use this technique the restriction does not apply. To make sure your column is supported for these controls, execute a SELECT DISTINCT on the column. The error means that you cannot use this column. The solution is that you should change the data type of the column to VARCHAR(MAX) or NVARCHAR(MAX)
- Modifying Slowly Changing Dimensions are not supported automatically, you need to implement your own logic as a SQL trigger for instance to handle this scenario.
- Complex security rules should be implemented by either built in SSAS roles with DAX or with Row Level Security policies in SQL Server. However, you have the possibility to control write-back on row level both front-end and back-end side, see Write-Back Security chapter.
- Non-writable views which serve as a data source for the table are not supported for write-back. Either materialize your view into a physical table, reduce the complexity of the view or you can create INSTEAD OF INSERT | UPDATE triggers to handle the operation. Typically, non-writeable views contain complex SQL queries with multiple joins, CASE statements in WHERE clauses, CTEs (Common Table Expressions), and aggregations. You can test your view by duplicating it under a different name and executing an INSERT statement against it. If a view is writable and write-back still does not work, try to use SELECT DISTINCT in the view definition.
- In the case of on-premises Power BI Report Server at least January 2019 version is required together with Power BI Desktop 2019 January or more recent versions.
Setup and Configuration of the Visual
This main section describes the available configuration options for the Table Editor. Also, the following pages describe short step-by-step instructions for building a simple report using VTE. You will find the details of the configuration elements later in this document, it is recommended that while you are going over the steps you also look up each mentioned option.
Validate the Write-back Service
After installation you might want to be sure that the write-back service is installed properly. You can validate that by navigating to your deployed URL, which is in the following format:
http(s)://yourserverName/PPWebService/PPWebService.svc
If you see the following page after the page load, then the Write-Back Service is up and running.
Setting up the Basics
After you launched Power BI Desktop, connected to a data source, and imported the visuals (VPService, Table Editor) into your report, the very first step is the configuration of VPService visual.
We must tell the visuals where they can find the write-back service and which connection they should use during the process. You can see detailed information in this chapter how to configure VPService.
The configuration options will appear in the Format section of the Visualizations after you dropped the first column into the Table Editor visual. You must complete the following steps to have a working report element for the write-back functionality.
Starting with [Data Entry], you must set the Web Service, Type and Connection properties (see referring chapters) to make the write-back service working.
Note! The content of [Data Entry] » Web Service property has to be exactly the same (case sensitive too!) like in VPService ([Web Service] » Url).
By default, the visual has a delay setting while you are modifying the table layout and it is set to 5 seconds. This is for handling lags when the end users are editing the report on the report server or in the cloud, but for authoring in Power BI Desktop you can lower this value if you go to Style » Settings Edit Delay. Recommended is 3 to 5 seconds.
Selecting the Table and Adding Columns
When the basics are set, you need to specify on which table you want to use the write-back functionality by setting the appropriate value in the Source Table property. The Source table defines the target table, so each data modification will be saved to this entity. Keep in mind, that although you can add other fields to the visual as well (e.g.: your ‘Customer’ table is the target, but you also want to display sales value for each customer from the Sales table by adding a field or a measure) only fields that belongs to the source table will be taken into consideration during write-back.
You must add the primary key of the table to the visual, so having a primary key defined on your table is necessary. Auto increment fields (like IDENTITY type in SQL) work the best. You can add as many columns as you want from the table. Relationships defined in your model will be followed automatically by the Power BI engine, so you can add related table columns as well, but as again, keep in mind that only those changes will be saved which are made on the selected table are defined in the Source Table property.
After you select your desired columns make sure that all the fields (which you want to include during the write-back) are set to Don’t summarize in the Visualizations – Fields – Values section.
General
The General tab allows you to view the version details of Table Editor and also the other settings.
Flash Suppression Threshold (ms) - allows you to define the time span for the visual to render upon first load. By default, the value is set to 10000 ms.
Configuring Columns
After setting up the basics, for each column you dropped to the visual’s field list you will see a set of configuration options under the [Column Properties] section under [Data Entry] group. These properties let you to set the appearance and behavior of the columns in your VTE. The most important setting is the Column type. For the primary key field, it must be set to ID, all other cases should correspond to the underlying SQL column data type. You can specify if you want the column to be read only – so that you overwrite the general Enable Editing configuration per column-, you can change the header of the column and set the desired theming as well. For all properties see the Configuration Options – Column properties chapter.
Enabling Operations
You can globally set which operations are allowed on the visual. A typical use case is that Delete, Editing and Inserting operations are granted, but you might want to restrict some operations. You can find all available options in the Configuration Options – Data Entry chapter.
Applying Style
In the Style configuration section, you can specify global theme settings as you would do it in any similar visual. Visual specific properties can be found in the Configuration Options – Style section.
Publishing and Testing the Report
When you finished with your report, publish it to either your on-premises Power BI Report Server or to PowerBI.com. The write-back will only work reliably when your report is published, so you cannot test the full functionality in Power BI Desktop while you are authoring it. After publishing your report try to modify the value and click on Save Changes. To validate that your changes are committed to the database, connect to your underlying database where your table can be found with a tool like SQL Server Management Studio, and execute a SELECT * FROM yourTable statement to see the content of the table. Your modification should be visible there and in your report.
Completing the above steps, you should have a working, simple, write-back capable report using Table Editor visual.
The following pages cover more detailed configuration options as well as typical use-cases that you might find useful for your needs.
Configuration Options
This chapter contains detailed description of the available configuration options for Visual Table Editor.
Data Entry
This section contains the configurations regarding the main behavior of the visual.
WebService
Here you must set the write-back service URL which should point to the hosting machine – or app service – where it was installed. Typical URL is:
http(s)://WEBSERVICE_COMPUTER_NAME/PPWebservice/PPWebservice.svc
Be careful not to have an extra slash at the end of the URL. This has to match the URL that is set in the VPService helper visual configuration.
Type
This option refers to the connection type that the write-back service will use. The setting is required.
- : Set a connection name in the Connection property defined in the web.config of the webservice
- : The connection is set in the PPWebService web.config and you will have to refer it by its name in the Connection property
- : Set the connection string directly in the Connection property (leave the connection blank if using the default "SSASConnection" in set in the web.config of the webservice)
- : Set the connection string directly in the Connection property (leave the connection blank if using the default "SQLConnection" in set in the web.config of the write-back service; meaning, leaving it blank, it will automatically look for the connection called "SQLConnection" in web.config)
These last two options are used for testing, developing purposes first.
Windows Authentication
If you are in an on-premises environment using Power BI Report Server and Windows Authentication is turned ON in the IIS for the write-back service this setting must be turned ON, so that the Windows credentials can be passed back to the underlying data source. If you are completely in the cloud - your reports are published to PowerBI.com service - and you are using Azure AD (Active Directory), the setting should be turned OFF, so that AD credentials will be used when accessing the data source.
In the case of Gateway turning Windows Authentication ON will have the following effects: Instead of setting the PowerBI.com credentials in the write-back service request, the visual posts the windows login context. This value (e.g.: domain\user instead of username@domain.com) will be set if you use USERNAME() in computed and/or default value columns (see later in this document) as well in SQL context variables. Also, this makes it possible to use impersonation, and it is necessary to be turned ON if Windows Authentication is set in IIS for the write-back service.
Connection
Specify Name of the or connection defined in the web.config file of the webservice, or the connection string directly, or leave blank depending on the Type setting.
Customer
The CustomerName was provided by us along with the License server license key. If already specified in the web.config file (you do not have to set this as it is done by the setup), leave it blank. If you are sharing a Webservice between multiple license keys, specify the customer key here, what you want to use.
Domain
Set it to one of the following. This should be left blank as it is configured in the write-back service web.config file during setup.
- the fixed the name of the internal domain used (e.g., DOMAIN)
- auto: use the domain part (part after @) of the powerbi.com user
- auto-short: use the short domain part (part after @ and before the .) of the powerbi.com user
- azure: use the full powerbi.com username (e.g., user@domain.com) for Azure AD authentication
- leave empty for no domain (e.g., for a SQL authentication user)
- SQL=…,SSAS=… set domain options for SQL and SSAS separately
- Custom user mapping of powerbi.com users to SQL and SSAS users can be set up in the UserMapping table in the SQL database (should contain User, SQLUser, SSASUser varchar columns) For more information please visit: https://support.poweronbi.com/portal/kb/articles/custom-user-mapping-when-using-powerbi-com-service
Source Table
It is important that you configure this property correctly as misconfiguration can lead to save-errors. Please read this chapter carefully.
This property will tell the write-back service which table should be the target for data modifications. The name of the write-back target table needs to be entered here. Note that the property is case sensitive! For example, if you put fields into the visual from the Product table, this property value should be Product as you want to save the modifications to the product table.
You should not rename tables or columns in your report. If you need to change the visual representation of a column, you can use the Title property for the column under [Column Properties].
In the case of SSAS data source the value must be the name of the entity exactly how it is specified in the model.
In the case of SQL only data source the value must be the name of the SQL table that is being used with the visual.
In the case of SQL connections when the table is in a different schema than dbo, you need to make some adjustments. When you import a table with a schema to a report, Power BI automatically tries to rename the table for you. For instance, if you are importing hr.SalesPerson table, in the Fields section you will see it renamed Hr Sales Person. Because of this operation, VTE will not be able to determine on which table it should initiate the write-back process. Please do the followings to overcome this situation:
- Rename the table in the Fields list so that it contains exactly the actual SQL table name without the schema (in the example it is SalesPerson)
- Remove and re-add the columns to your Table Editor
- Enter the Source Table property the fully qualified table name in the format of: schema.table (in the example it is hr.SalesPerson)
Image URL (Displayed)
You can set an image to be displayed instead of the table defined by a URL. More information is in the Use Cases chapter regarding this.
Image Link
If this property is set, clicking on the image (defined in by the previous setting) will take you to the specified URL.
Image Position
Set the position of your image:
- Original: The original size of the image will be kept
- Contain: The image will be resized to fit inside the visual, so it will touch at least one side of the border
- Cover: Works as panscan, the image will be cropped.
- Stretch: If the image is smaller than the visual, it will be stretched to fit. The image can be distorted.
Enable Delete
If it is turned ON, a trash icon will be displayed for each row which enables users to delete the selected records.
Enable Editing
If it is turned ON users will be able to edit existing records. You can set the nature of editing by setting the Details Editing property.
Details Editing
By enabling details editing instead of a table format view that you have by default, you can have a form view where only the selected row’s properties are visible. You have the following options:
By selecting the Optional setting, a details icon appears beside each record in the table. By pressing the details icon, you can enter the details (forms) layout for the record.
By selecting the Exclusive setting when you start changing values in a row it automatically enters the details edit layout for the record.
Under [Data Entry] » Layout if you select the Details layout option the Table Editor will always stay in the details (forms) layout.
Enable Filtering
By enabling this setting, an additional row will appear above the first row, and for each column the end user can search. The behavior of the rendered filter cells is matched to the control type of the column. So, you can filter by entering text if the column data type is text, or by date picker if the data type is date or time, etc.
In the case of a date picker, on the panel you can switch between years with and
buttons.
Enable Insert
By enabling this setting, the end user will be able to add new records to the database. By clicking on insert an extra line will appear above the first row into which the new data can be entered.
Enable Import
Note! This feature requires a PPWebservice (the backend part and not the visual) upgrade which has been released in March of 2022. If you have an older version, the import will not work.
How to use import in Table Editor?
Enable the import feature under [Data Entry] property group, by turning ON Enable Import property.
A new [Import] button appears immediately on the top button row.
By clicking on [Import] button, a new window pops up:
After selecting a file, the name, and the size of it will be displayed on the window:
Click on [Import] to start the uploading process.
While the uploading and processing are in progress, the following window will be shown:
After a successful upload:
File format
Import supports only .XLSX, .CSV and .TSV file extensions.
The name of the columns in the file should match the SQL and model side.
By default, the engine will do an insert or update operation based on the Primary key / ID column of the file. If an ID is already in the SQL DB, it will update that row, otherwise insert a new row.
Users can determine the operations by each row by adding an Operation column to the table.
The following operations can be applied:
- add à Inserting the current row as a new record of the table. In case of Primary Key conflict, it will throw an SQL error.
- upd à Updating the current row based on its ID. If there is no row in the SQL table with that ID, it will throw an error.
- del à Deleting the current row based on its ID. If there is no row in the SQL table with that ID, it will throw an error. In that case other columns in the file can be empty, only the ID field is necessary.
Some examples for the Excel file:
Error messages
When an error occurs during the write-back process a new window will pop up after the processing window:
Clicking on the sample link above, an Excel file will be downloaded which contains every row where the write-back failed and in an Error column, the corresponding error message will be written.
e.g.:
Limitations
- Import feature requires the latest PPWebservice upgrade (released in March 2022)
- The source file should contain only a single sheet (in the case of .XLSX), starting from A1 cell
- Formatting is not imported, only the raw data
- The file should contain at least every column which is represented in TE. Additional columns in the file will not be imported
- While the uploading is in progress, the browser tab cannot be closed until it finishes with the processing step
- At the same time only one import process can be active per connection or table
- There is no limitation on file size, but a larger file takes more time to upload and process.
- Based on the number of rows and columns (over ten thousand rows) the import process can take even a few minutes long.
Enable Paging
By turning this setting ON, a paging bar will appear at the bottom of the visual. Not all rows will be loaded, only ten rows per page which gives the end user a faster response time. You can control how many rows are displayed on one page by setting the Page Size property.
Enable Set All
By enabling this a Set All bar appears at the bottom of the table editor. For each column you can enter or select a value here and press the Set button to set all values to the entered value. For numeric columns you can also use the inc, dec smart formulas (e.g.: inc10%). All values will be set (considering the limit of 000 records) – not just the one you see on a given page.
Enable Sorting
By turning this setting on end users will be able to sort data (ascending or descending) by clicking on the header of a column. Only one column can be set for sorting at a time.
Enable Totals
After enabling this setting an extra row will appear at the bottom that will contain a sum of numeric values of the full available dataset. Only those columns will have this value where the column data type is set to Number.
Enable Page Totals
If this feature is enabled end users will also see the sum of the numeric columns on the actual page. If totals are also enabled, you will see the values in the format of: Total of the dataset (Total of the current page).
Enable Section Totals
For this setting to work, you must enable Section ON at least one column under [Column properties]. In that case rows will be grouped by the section columns, and if Section Totals is enabled numeric type columns will be aggregated and displayed in the section header.
Enable Duplicating
A duplicate icon appears beside each record. If you press it the table editor makes a copy of the record, where you can change respective values and save changes.
Enable Row Selection
By enabling this setting, you will be able to pass the current row as filter context to any visual on the current report page. So, whenever an end user clicks on a row, other visuals will be filtered by the selection (only those entities will be affected that are in a relationship with the table in question). And the actual row id (the primary key of the row) will be selected in the actual filter context which will be propagated thru the entire relationship and the value can be used in another Table Editor on the same page. For instance, if you selected product A01, and you created a simple table that shows sales per month, it would present you with the sales for the selected product. This setting should also be used in a master–detail use case where you have two Table Editors on a page, and you want to pass down the selected master record to the detail table. In this case one of the detail’s table columns – that acts as a foreign key should be – the setting: Parent column under [Column properties] should be turned ON. You can find this use case described later in this document. See in the more detailed description in this chapter.
Auto Save
After enabling this setting, changes will be saved back automatically when the user leaves the current row.
Only works in case of editing and not inserting.
Instant Save
The value will be saved back immediately and automatically after leaving the cell.
Only works in case of editing and not inserting.
Hide Save Changes and Discard Changes
If you enable any of these settings (‘Auto Save’ or ‘Instant Save’), an additional property appears in [Style] group, which is called ‘Hide Save Changes and Discard Changes’. You can enable this property, if you like and by this way the ‘Save Changes’ and ‘Discard Changes’ buttons disappear and the saving will work like how the ‘Auto Save’ is working for both cases. (Meaning it saves after leaving the row you just have modified).
Instant Edit
By default, you need to double click on a cell to edit it. If this setting is turned ON, instead of double click, values can be modified immediately by clicking on the cell.
Auto Refresh
If it is turned ON, after saving the full visual content will be refreshed to fetch new data. If it is turned OFF, the data source will not be queried.
Saving Complete Message
If it is turned ON a visual notification will be presented for the end user after a successful save in the bottom right corner.
Save Read Only Values
If duplicating is enabled AND you have a write security column or a column from a different table than the source table – meaning the content cannot be modified AND
- ‘Save Read Only Values’ is disabled:
After you click on the duplicating icon on a row, the copied content of the read only cell can be seen, however, when you save the new inserted row, the read only cell will not be saved back to the database.
- ‘Save Read Only Values’ is enabled:
After you click on the duplicating icon on a row, the copied content of the read only cell can be seen and when you save the new inserted row, the read only cell will also be saved back to the database.
Input Culture
If end user’s browser’s culture or regional setting is different than the SSAS model property, it might happen that the numeric figures entered will not be saved correctly. If you experience this, set this property to en-US (only this one is supported) so that the figures formatting will revert back to a reliable one.
Date Format
You can set the date format for each date type column.
Layout
You can determine the layout for the records by setting one of the following options:
- Table: you will see all records in a table formatted manner. One record in one row, multiple rows on the same page.
- Details: you will see each record on a form basis. So, on each page the end user will be able to see one record at a time.
Single Transaction
When you are editing multiple records at the same time you can control how these rows are committed back to the underlying database. If this setting is turned ON, all modifications will be saved back in one transaction. If it is turned OFF, each row will be committed in a separate transaction. Only applies to data sources where transactions are supported natively.
Filters Remain After Save
If the filtering option is enabled and you filter a column in the header of the visual and you modify and save something, the filter will be kept even after the saving.
Column Properties
These settings will appear for each field that you dropped on the visual. With these you can control the behavior and appearance of the columns in the visual.
Visible
By turning it OFF the column will not be rendered to the end users, however data contained within will be written back during save.
Column type
You need to set the data type for all the columns that are on the visual. Making changes in this setting will influence how the cell will be rendered and how it is going to behave. Types can only be set for those columns for which the aggregation is set to Don’t summarize in the report field’s list window as only these fields can be saved during write-back. You can choose from the types below. If this setting does not show up then make sure that the Source Table property along with the WebService URL and connection properties are correctly set.
ID
VTE requires a Primary Key column to be defined in the table. This column needs to be defined as an ID column types in, and will hold a unique value per row. This column might be an identity column from SQL Server, in this case you might want to turn the visibility OFF for this field. If the key is not automatically determined by the server when inserting new records, then end users must enter a value for this, or use some DAX calculations to define a default value.
Text
One-line Textbox in the grid.
Text Area
Multi-Line textbox in the grid.
Number
This type should be used in all numeric data types (decimal, currency, whole number) Number type columns can have format strings, which can be also extended. You can format in thousands, millions, billions, trillions using the following syntax: (space) K,M,B,T after the format string, e.g.:
$# ### ##0 K
$# ### ##0 M
$# ### ##0 B
$# ### ##0 T
- https://github.com/Microsoft/PowerBI-visuals-core/wiki/Value-Formatter
- https://github.com/Microsoft/powerbi-visuals-utils-formattingutils/blob/master/docs/api/value-formatter.md
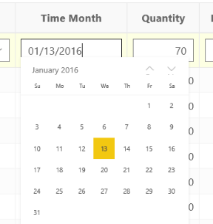
Date
The Date Field brings up a data picker where you can set the date:
When the user browses to a date, it returns that field back
to the date field. The SQL Database field should be of the
type Date or DateTime.
DateTime
With this setting the time can be also set besides the date.
Selection
Using this column type, a dropdown control will be rendered for each cell in this column. In this case additional properties must be set. You can either define a fixed list of available values or you can use another related – or lookup - table to supply them.
For fixed list, provide values in the Dropdown items list input, separated by semicolons. If you also want to provide blank/empty value, use the following format: ;APPLE;TONIC;COLA. In this case no other settings are needed. During save the selected value will be written back to the underlying table.
In case when the table has a foreign key with a numeric column which is in relationship with another table, and instead of showing the number you want to show the actual text representation of it to the end users and provide them the possibility to choose from a set of values, you might want to use that table to populate the dropdown. To sum, you have a Look Up table in your model. To be able to use it you need to adjust additional settings.
Selection type columns have the following settings:
- Source Table: table that contains the values for the dropdown list. If you are using SmartFilter visual to cache data (described in the next paragraph), you need to enter the name of the table as it is displayed in the Fields pane. If you are not using it or you connected to a SQL database directly, you need to provide here the name of the SQL table. If it is in a different schema then dbo, you need to provide it as well in the following format: schemaName.TableName
- Dropdown Display: This value will be displayed after the lookup. Usually this is the text field of your lookup table.
- Dropdown Value The value that will be matched in the lookup table using the value in the current cell. Usually this is the key column in your lookup table.
Row Display Column: You can show different values in the dropdown when that is active then what you see on the rows, so you can adjust what should be displayed in the cell. If you want the same as shown in the dropdown you just need to leave this setting empty. However, if you want to display a different column from the same base table (e.g.: instead of the Customer Name the Customer State) add this column as hidden to the Table Editor and provide the name of it here. In the example above we have the Customer Name from Customer table and the Sales measure from the Sales table. We have created a dropdown for the Customer Name using the Customer lookup table, but instead of showing that property in the rows, we display the state of the customer. When we edit the cell, we will see the customer names in the dropdown.
When a source table provided there can be two ways of getting the data for the visual. By default, the visual will use the write-back web service to retrieve the data by querying the underlying data source. With this method, RLS defined in SSAS will not be honored, as all data will be fetched from the source SQL table. In some cases, this extra round trip to the server can be slow. You can increase the performance and honor any existing RLS with the following technique.
Import the SmartFilter Helper visual to your report (use that is provided in the setup kit, you should not obtain it from the marketplace) and add it to the report page. Add those fields (ID and name) to the SmartFilter visual, that are used for the dropdown: the display value and row display column. Using this, the available values for the dropdown will be stored in the SmartFilter, Table Editor will recognize it, so it will not query the write-back service.
If you experience some delay in rendering the dropdown values in the cells, you can adjust the Get Dropdown Values Retry Count and Delay settings under Style:
If your table in question has a relationship with table that provides the value for the dropdown control, you can further increase performance by applying the following steps:
- If not already present, add the related table and column for the display column to the data model (along with the relationships to the source table)
- Add the related name column to the Table Editor columns (can set visibility to false)
- Set the Row Display Column property to the name of the related name column (as it appears in Power BI, not the SQL column name).
Filter on SmartFilter
If you want to restrict the available values in the dropdown, you can do that.
After adding the fields (ID and name) to the SmartFilter in your report, apply a visual level filter on the SmartFilter to restrict the available values. In this case you will not see all possible values in the dropdown for selecting purposes, however you will be able to see those rows in the Table Editor visual, which have other values than the available ones.
You can find a detailed possible use case in this Knowledge Base article in this topic.
Check Box
Column types for Boolean values can be set to Check box.
Link
For certain column types you can enable Link of a Dashboard or Report in Power BI. The PBI Admin author defines the “Link” setting as follows:
https://app.powerbi.com/reportEmbed?groupId=[PBI GrouId]&reportId=[Power BI Report ID]&filter=FilterTable/FilterColumn eq '[ListTable].[ListColumn]'
Where [ListTable].[ListColumn] is a column in the Table Editor (can be hidden), and FilterTable/FilterColumn is the column the drill through report is filtered by (cannot contain spaces)
e.g.: https://app.powerbi.com/reportEmbed?groupId=de5b6768-f934-42ab-8bfb-d116580969a5&reportId=d6da3384-38ea-4bf1-9c82-83a782dda6de&filter=Product/SKU eq '[Sales].[Product SKU]'
You need to activate the [Column Properties] » … Open Link In New Tab option for a Link type column, the report specified in the [Column Properties] » … Link property should open up in a new tab. Please note that this type of link needs to be in the standard report URL format e.g.:
https://app.powerbi.com/groups/67b8eeaf-429d-477f-aa89-78949e9a7b00/reports/a791d2f5-9e87-4dc9-a7c6-b55e7fa5ad3d?filter=FilterTable/FilterColumn eq '[ListTable].[ListColumn]'
If you want to use URLs from other columns or measures, you can refer to them with the same [TableName].[ColumnOrMeasureName] in the Link property field. That column or measure must be placed in the TE but can be hidden. In this case the open link in new tab should be turned ON.
Link filter
If this property is enabled, assuming you have a column with a clickable link, and you click on the link in a row, it will show you those data (from a sub-report for example) which related to that particular row.
Otherwise, the link shows every row.
User
In some special cases the user cannot be automatically determined from the PowerBI environment. In this case you can include a user column in the table to determine the current user for security purposes (e.g. using the USERNAME() formula in DAX or the CURRENT_USER in T-SQL)
Image
If the column contains URLs that are pointing to an image and you want to display them in the cell, you should choose Image type.
Search Box
For larger lookup tables use the Search Box field type instead of the Selection. This displays a textbox control where the user can type in part of the name or id and it displays a dropdown list of names and values the first few matches.
For the search box to display a name column instead of the value column, the related name column and table needs to be added to the data model and set up as the Row Display column, similarly to the Selection column type. Also add the name column to the Table Editor as hidden. If the Row Display column is not set the name column is only displayed in the search dropdown and the value column is displayed in the table.
In case of SSAS Import models the response time is tied to how fast Analysis Server can respond as DAX & MDX queries are used. That could result in a slower performance.
Title
If you need to display a different text in the visual then how it is displayed in the field list, you can rename the header for that column by specifying a new value here.
Show Total
Only available for numeric type columns. If it is turned ON values will be summarized in the footer section.
Computed Value
To define a value for a given column for display and for write-back, you can use simple expressions to obtain a value in run-time.
The expression can contain:
- DATE() – Current date without time
- NOW() – Current date with time
- USERNAME() – Current Power BI user’s username part
- DOMAIN() – Current Power BI user’s domain part
- USERPRINCIPALNAME() – Current Power BI user full email address format
- TableName.ColumnName – value of another column in the same record
- TableName.MeasureName – Let us assume we have a measure:
Table.Column1 * Table.Column2.
Necessary steps:
- Measure should be included as a column into the Table Editor
- You can hide this measure (see Visibility property on the column)
- Add TableName.MeasureName to that column‘s Computed value property where you want to apply the Table.Column1 * Table.Column2 expression.
- other fixed string
- JavaScript expressions that an eval statement can evaluate e.g.:
- Table.Column1 * Table.Column2
- To change time zone to a specific one: "Table.Column".toString().substr(0,0)+new Date().toLocaleString('en-US', {timeZone: 'Asia/Tokyo'})
If a Computed value is set to a column, then the column becomes read-only. Even if the column is read-only, the Computed value will be written-back to the database. This is also true for the situation when the column is hidden (not visible). The value calculated by the Computed value will always be recalculated.
In the case of a non-inserted row: The Computed value does not appear instantly in the cell, only after modifying another cell in the related row.
In the case of an inserted / duplicated row / ”Always Show Insert Row”: The Computed value appears in the cell instantly.
This setting can be used with the ’Display Default Value’ setting too. See the Display Default Value section for how the two settings work together.
Default Value
Default value works similarly as Computed value.
In the case of a non-inserted row: The default value does not appear immediately in the empty (BLANK or null) cells, only after modifying another cell in the related row.
In the case of an inserted / duplicated row / ”Always Show Insert Row”: The default value appears in the cell instantly.
In an empty cell where a default value has been set up, the default value will appear when you double-click on the cell; &
- If you just leave this cell by clicking somewhere else or hitting one of the arrow buttons on the keyboard, the default value will disappear.
- If you hit the ([Shift]+)[Enter] button on the keyboard, the default value will be written into the cell.
- If you complete the default value with additional information, no matter which button you hit on the keyboard (an arrow, [Shift]+[Enter], [Enter]), the content will be written into the cell.
In a non-empty cell where a default value has been set up, the default value will not appear when you double-click on the cell.
If a column is set to read-only, then the ‘Default Value’ setting disappears from the [Column Properties].
This setting can be used with the ’Display Default Value‘ setting too: See the Display Default Value section for how the two settings work together.
Display Default Value
With Computed value property: If the ’Display default value‘ is turned ON, then the Computed value appears in all cells of the column, no matter if we edit the row or not.
With Default value property: If the ’Display default value‘ is turned ON, then the Default value appears immediately in all empty cells (BLANK or null) of the column.
Connection Between Computed Value & Default Value
If the column has a Default value & a Computed value, then the Computed value will be shown because it is a higher priority.
If the column has a Default value only, then the Default value will be shown.
Read Only
Turning this setting on will prohibit any kind of update on the given column. Columns originated from a different related table will be automatically set to read only.
Exclude Column from Save
If it is turned ON the value will not be saved during write-back.
Wrap Text
If it is turned ON, long texts set with Text Area column type will be wrapped to fit the current cell.
Width
A custom width for the given column can be set in pixels.
Required
Turning this setting on will make the column mandatory. If the given cell has blank value, changes cannot be saved.
Alignment
Set the text alignment for the column.
Section
Turning this property ON for the column and sorting it by the same column will result in a grouping on the current page of the visual.
Conditional Formatting Source Column
Conditional formatting will be copied from the source column where its Conditional property has been already set up.
E.g.: Conditional formatting has already been setup for Price:
Typing Price into the Customer Name Conditional Formatting source column will apply the same style for Customer Name column as you can see in the screen shot below:
Format
It is available for numeric and date/datetime type of columns.
You can specify a format string which will be used to render the number or date/datetime columns.
Date format example:
- DD/MM/YYYY
- MM/DD/YYYY hh:mm:ss
Date format priority list:
- The primary date format is, taking it from [Column Properties] » Date Format property
- Secondary date format is from [Data Entry] » Date Format property
- Last but not least the 3rd option from the priority list is taking the date format from database/ Power BI/ etc.
Conditional Formatting
Only available for numeric type columns. When enabled you can define 10 ranges with dedicated colors that will be applied for the given cell.
Note: If you are using computed value and conditional formatting on the same column, the base of the coloring will be the original value of the column and not the result of the computed.
Primary Font Color
For each odd row, the text will be rendered in the given color.
Primary Background Color
Each odd row will have the set background color.
Secondary Font Color
For each even row, the text will be rendered in the given color.
Secondary Background Color
Each even row will have the set background color.
Parent Column
This setting should be used together with Enable row selection setting and intended to be used in a master-detail scenario. If you have multiple VTE on the same page of your report, and you have enabled row selection on your master visual (e.g.: it is editing the product category), you can enable this setting on your detail visual (e.g.: product). Upon new record insertion, the visual will capture the master Table Editor’s primary key and will use that value for this selected column. See in more detailed description in this chapter.
Write Security Column
You can prohibit modifications on a given row by creating a calculated column or a measure in your model or in your report. The formula complexity is not restricted, so you can develop any kind of logical evaluation of the present columns and the filter context to determine if the selected row is editable or not.
The write security column must return one of the following values:
- empty string or Blank value, if the cell should not be eligible for modifications
- any value (preferable 1 numeric or TRUE Boolean) to allow modifications.
- For instance, the following measures can be used:
- CanWrite = IF(VALUES('Product'[BrandId]) = 1;"";1)
- Which means that those products that belong to the Brand, where the Id is 1, will be read only.
- For a more complex case when you want to control security based on user privileges as well, you can use the following pattern:
- IsWriteable:=MAXX('UserMapping',IF('UserMapping'[UserName]= USERNAME(),"",1))
You need to add this measure to your Table Editor and enable the write security property for this column.
For a detailed example, please refer to the following article:
https://support.poweronbi.com/portal/kb/articles/implement-complex-write-security-per-entity
Style
Properties that are predicated on PowerBI default settings or which are self-explanatory are not listed here, only Table Editor’s special settings.
Cell Padding
You can increase or decrease the padding to all cells, in pixels. However, if icon(s) can be found in rows (e.g.: trash, duplicating), the icon(s) determines the height of the row.
Page Size
You can determine how many rows you would like to see in one page, by giving a number, e.g.: 10 (rows).
Always Show Insert Row
If it is turned ON, a blank row will be displayed on the top of the Table Editor, for new record insertion.
If Enable Insert property is disabled, this setting will be hidden.
Minimum Row Height
This determines the minimum height of the rows in pixels. Its default value is 40. If you have an icon in your row, e.g.: trash icon, it determines the minimum height.
Controls on the Left
The icons of the enabled operations will be displayed on the left instead of on the right.
Table Transparent
By turning this setting on the table becomes transparent so that background settings on the page will be visible behind the visual.
Possible use cases:
- Your Table Editor has an own color, meaning ‘Background’ in ON & ‘Transparency’ is 0%. If in this situation you enable Table Transparent, to be able to experience the transparency, you need to set ‘Transparency’ to 100%.
- If ‘Background’ is OFF & Table Transparent is enabled, your Table Editor becomes transparent.
- If header / footer / value / total / Set All background color is set to a color and you enable Table Transparent, your Table Editor becomes transparent.
Header/Footer URL
Applies only in print mode. The entered image will be rendered in the header / footer of the printed page.
Dynamic Header/Footer Content
Applies only in print mode. The text entered in the setting will be rendered on the document in the header / footer section of the printed page. Allows users to display additional information (in HTML or plain text formats) in the header, footer, end sections, after the Header/Footer/End URL's content. The content here is limited to 250 characters due to Power BI limitations. The following keywords are replaced with their respective content in these sections: USERNAME(), NOW(), DATE()
Take Footer Style Setting from Header
The printed header style will match the visual style if this setting is turned ON.
Apply Column Alignment to Header
The printed header alignment will match the visual style if this setting is turned ON.
Display Column Name in Section Header
If there is a column where section is enabled and this setting is turned ON, the title will be displayed for each section as well.
Text Area Display Line Breaks
Replaces <enter> line break chars with html compatible line breaks <br> in Text Area type columns.
Get Dropdown Values Retry Count
The value provided here will control the visual that how many times should it try to get the values for the dropdown columns in case of unsuccessful retrieval, in case the dropdown values are retrieved from a SmartFilter helper visual.
Get Dropdown Values Retry Delay
The setting determines the delay in seconds between each try.
Wrap Header Text
There are three different operations for wrapping:
- no wrap: works like in the previous versions.
wrap with ellipsis: wraps the column header text if necessary (e.g.: the visual is too narrow or has fixed column width which indicates wrapping) and if it is still too long and there are no spaces left to break the header by them, so, displays ellipsis.
wrap with word break: it breaks the words until it fits into the cell width.
External Stylesheet
The External Stylesheet processes both the CSS URL and the CSS code. If you are using fonts that are not web-safe, you will need an external stylesheet to render the fonts properly. You can specify the URL in the stylesheet. To be able to reference the font by its name in the visual settings, ensure the CSS contains woff fontface definitions.
For example, refer to this CSS code:
Sample CSS code:
.control.button.demxButton:not(.disabled) button {
background-image: linear-gradient(to top, rgb(0, 0, 255), rgb(0, 0, 155));
color: rgb(0, 255, 255);
padding: 15px;
border-radius: 10px;
margin: 5px;
}
.control.button.demxButton.disabled button {
background-image: linear-gradient(to top, rgba(51,51,51,0.25),rgba(51, 51, 51, 0));
color: rgb(51, 51, 51);
padding: 15px;
border-radius: 10px;
margin: 5px;
}
.control.button.demxButton button {
background-image: linear-gradient(to top, rgb(0, 0, 255), rgb(0, 0, 155));
color: rgb(0, 255, 255);
padding: 15px;
}
Use Cases
This chapter describes typical uses cases that you can implement in your environment to enrich Table Editor feature leveraging native database objects. Chapter references Microsoft’s SQL Server’s features.
Copy – Paste in Table Editor
What you need to know about copy-paste functionality in Table Editor at the moment is, being able to paste more lines, you have to take care of the following settings, considerations:
- Set 'Page Size' to that number how many rows you would like to paste. Because you can insert as many rows as the 'Page Size' is set. (The default value is 10.)
- Be ensured 'Instant Edit' property is disabled. Otherwise, everything what you have in your clipboard, will be pasted into one cell. Because in case of instant edit for the first click on the cell the cursor can be seen inside the cell.
- Click on [Insert] button as many, as many rows you want to paste.
- Copy the content from Excel and paste it from the proper place.
- If you have a selection type of value in your Table Editor, make sure you have the exact content, from where you are copying.
- Make sure you
- did not change the order of your columns
- you have the same type of columns
- from where you are copying.
Performance Optimization
In case of large fact tables reprocessing in-memory SSAS models can take some time. The write-back service can determine which portion of your data should be processed. For that you can implement special partitioning. Please refer to the following article in our Knowledge Base for examples, walk throughs and tips:
https://support.poweronbi.com/portal/kb/articles/performance-tips-for-direct-query-mode
https://support.poweronbi.com/portal/kb/articles/performance-optimization-tips
Note, that if you implement the Partitioning technique, you need to add the Partition column to the visual to the field collections. That means that this column must be visible in your SSAS model. You can turn visibility OFF in the visual under [Column Properties]. Also turn ON read only for this field.
Custom Validation
You can create complex validation logics by leveraging SQL server features, more precisely triggers to check certain conditions and send back message to the client in case of violation of a business rule. The core logic of the trigger can contain anything you like, only the return method of your message needs to be in a certain format. The following example shows how to return a custom message in a trigger:
IF (@YourCondition)
THROW 50001, N'<SQLError>Cannot save modifications due to violation of business rules.</SQLError>', 1
Auditing
This chapter will provide you a guide how to capture the username who is modifying the current record. Please refer to the following articles in our Knowledge Base:
https://support.poweronbi.com/portal/kb/articles/audit-data-modifications
For example, if you are using Table Editor to modify the content of the Product table, you can create a ProductAudit table with the same structure as the table in question with columns that can contain extra information about the operation, like:
- ModifiedBy – the user’s name
- ModifiedAt – the date
- OldValue
- NewValue
The following trigger will capture the actual user’s name and the current date, and saves it to an audit table:
CREATE TRIGGER [dbo].[trg_ProductAudit] on [dbo].[Product]
AFTER INSERT, UPDATE
AS
BEGIN
DECLARE @USERNAME VARCHAR(255)
SET @USERNAME = CAST(SESSION_CONTEXT(N'user_name') as varchar(255))
INSERT INTO [dbo].[ProductAudit]
SELECT
[SKU]
,@USERNAME
,GETDATE()
FROM INSERTED
END
Write-back Security Controlled within the Visual
You can control which rows are editable inside the visual by using a measure created for this purpose. This measure can be deployed into your SSAS model, or it can be an embedded measure in the report itself.
Add the write security measure to the visual and turn ON the Write Security Setting for this field. Please read the Write Security Column paragraph in this document.
Write-back security leveraging SQL Server Row Level Security Feature or Triggers
Please refer to the following articles in our Knowledge Base:
https://support.poweronbi.com/portal/kb/articles/implement-complex-write-security-per-entity
Image Columns with Tooltips
If the [Column Properties] » … column type setting is set to Image then the string values in the column data is interpreted as Image URLs and displayed in the column cell contents (column type can only be set for the table defined under [Data Entry] » Source Table).
If the Properties\ … Tooltip Column is set to a column in the same table, the value in that column in the corresponding row is set as the tooltip of the image.
Image Link Mode
If the [Data Entry] » Image Url, Image Link options are set up, the Table Editor displays a single image specified in Image URL, and navigates to URL specified in Image Link, when the image is clicked.
Master/Detail View with Bookmarks
If you are looking for a simple solution for master – detail editing, please have a look at the following article:
https://support.poweronbi.com/portal/kb/articles/master-detail-editing-with-two-table-editor
With bookmarks you can create a master/detail page structure showing and hiding detailed information to the selected row.
Set up Table Editors: Drag and drop one TE for master and another for detailed view. In master TE, Switch Enable row selection on:
In the Table Editor you want to use for details, switch Layout to Details:
If insert new rows into the detailed view, use the ID column from the master table as a default value of detailed view’s ID column.
Enable bookmarks: In view menu in Power BI desktop, turn ON Bookmarks Pane.
Show/hide visuals: In view menu turn ON Selection pane. With this you can show/hide visuals on a page.
Design page layout: Two bookmarks needed. On ‘master’ bookmark hide the detailed Table Editor, on detailed bookmark hide master Table Editor. On each bookmark, unmark the Data option so the master TE can filter the detailed one:
You can use shapes to navigate between bookmarks, there is an Action property where you can set what should happen once clicked.
Storing Image in Columns
Combining the latest version of the write-back service (at least version from July 2020, consult the knowledge base on how to update the webservice) with the Table Editor Rich text feature, you can save images into columns. In order to do that, you need to do the followings:
- Edit the web service’s web.config file, add the following key to the app settings collection: <add key="StoreImages" value="True" />
- With the above instead of storing the images as base64 strings inside the target SQL column, it will be converted and saved as a jpeg file in the web service’s Images folder. That is necessary to overcome html tag string length limitation set by the PowerBI service. Otherwise saving large images would result in an error while rendering the report.
- In the visual’s configuration under [Column properties] for the target column set the type to TextArea, and turn ON the Rich Text feature
You can find some more complex examples in these articles:
- https://support.poweronbi.com/portal/en/kb/articles/saving-images-to-columns-with-table-editor
- https://support.poweronbi.com/portal/en/kb/articles/table-editor-saving-images-as-comments
Troubleshooting
For all cases, please visit our Knowledge Base at: https://support.poweronbi.com/ to find a solution for your problem. Below you can find common cases. If your issue cannot be solved by the provided materials, please open a ticket on our support site, and Power ON will assist you. Also, you can use the debug settings of Table Editor – described in the next chapter - to acquire more details on the problem.
Column Type Configuration Setting is Not Showing up in [Column Properties]
Symptom: The property Column type is not showing up at all.
Cause: There can be three reasons for this: one or more of the following properties are not set correctly:
- Source Table – case sensitive, must match the table name
- Web service
- Connection Name / Type
Solution: Please read the relevant chapters in this document.
Cell Cannot be Selected, No Value can be Entered
Symptom: You have a write-back capable cell, but you cannot click into the input field, you cannot enter any value. The cell is not showing the selected status – default format is red bordered.
Cause: Most possible cause is that the column was renamed in the Power BI report. Each column that you use as a write-back target should have the exact name as it is in your SSAS model, or in case of SQL only connection, the name of the columns should correspond to the SQL table columns. It’s very typical, that for instance in SQL you have a CustomerName column, which is renamed to Customer Name in the report.
Another reason can be that the Source Table property is not set properly. Please read the relevant chapter in this document.
Also make sure that Don’t summarize is set for the field in question.
Solution: Match the names. You can give your desired header title for the column in the [Column Properties] » Title section. Examine the Source Table property, set the field to don’t summarize.
Please refer to these articles:
- https://support.poweronbi.com/portal/kb/articles/troubleshooting-writeback-and-dropdown-columns
- https://support.poweronbi.com/portal/kb/articles/trouble-shooting-data-entry-in-visual-table-editor
Missing ID
Symptom: You receive a Missing ID message when you try to save modifications.
Cause: The followings can be:
- Your target SQL table for the write-back does not have a primary key defined
- The primary key of the table is not imported/visible in your model
- The primary key field is not part of the column collection of the visual
- The Column Type property is not set to ID for the field.
- The column has been renamed.
Solution: Depending on the cause you should make the following adjustments:
- Create a primary key on the table (see pre-requisites) and import it to your model
- Import your existing primary key and make it visible in your model
- Add the primary key field to the visual. You can turn the visibility of for the column.
- Set the Column Type property for the primary key to be ID.
- Match the column names as it described in the pre-requisites section.
Network Error
Symptom: You receive Network Error message when you try to save data.
Cause: You may get this error typically in the following cases:
- the write-back service URL is not set correctly – or it is malformed - in the [Data Entry] settings
- the write-back service is not reachable or offline
- bad connection name or/and type was specified
- the license service is stopped unexpectedly
- Missing files in the web service folder, or typo / malformed strings in the web.config file
- Windows / Kerberos authentication issue
- Missing Service Principal Names
- Missing Active Directory permissions for service accounts
- Report server URL web service URL format mismatch
- Invalid SSL certificate
Solution: Make sure that the write-back service is up and running and reachable (firewall not interfering) as it is described earlier in this document. Verify that the referenced connection exists in the write-back service configuration and the connection type is selected correctly.
A particular error can indicate a license service failure. Please refer to this article:
If you encounter CORS issue, please check the web.config file of the write-back service for typo-s, and also missing DLL-s and config files inside the web service folder. As a last resort, try updating the web service file following these articles:
- https://support.poweronbi.com/portal/kb/articles/how-to-update-the-service-manually-azure-cloud
- https://support.poweronbi.com/portal/kb/articles/how-to-update
If you encounter SSL error, make sure that the certificate is issued by a trusted authority for the full qualified domain name of the IIS server, or that the certificate is set to ignore by the client’s browser in case of self-signed certificate, or if the certificate is issued internally by your organization and you try to reach the report outside of the organization domain.
If you are using Power BI Reporting Services on-premise, make sure that the Report Server URL and the web service URL format matches. Either both have to reference the machine name or the full qualified domain name, and both have to be http or https.
In case of on-premise installation in a domain with Windows Authentication, make sure that Service Principal Names are created for your SQL and SSAS servers and the correct domain users are used for the services. An SPN is also needed for the service account that is running the PPWebService on the IIS machine as the Application Pool user. Make sure that delegation is enabled in your Active Directory from the App Pool’s user (which has to be a trusted user) to the SQL/SSAS services. If these are not set correctly, Kerberos authentication issues can occur, which might result in HTTP 403 or 404 errors or appearing log-in popups. Please refer to the following article and contact your internal IT team:
https://support.poweronbi.com/portal/kb/articles/configure-iis-for-kerberos-authentication
The Visual is Not Working in Power BI Desktop or the Settings are Not Shown
Symptom: The visual is not rendered, or Table Editor specific setting are not displayed (like [Data Entry], [Column Properties], etc.)
Cause: Generally, there can be two reasons for this:
your machine is running out of memory, therefore Power BI Desktop cannot render the elements properly
your Power BI Desktop Cache is outdated.
Solution: Free up memory on your computer by closing other applications. For clearing the Power BI Desktop cache, please refer to the article in our Knowledge Base at:
https://support.poweronbi.com/portal/kb/articles/power-bi-desktop-clear-cache
Save Failed
Symptom: You receive Save Failed message when you try to write-back to the selected table.
Cause: You may get this error if there is a configuration error in your visual, the write-back service is not configured properly, or in the following cases:
- there is a custom validation implemented that prohibits write-back
- SQL objects are interfering with the data modification TSQL statements (like security policies, triggers, unique constraints, etc.)
- the service account used by the write-back service does not have permission on the underlying SQL database to make the necessary modification on the source table
Solution:
- Check if the service account has the necessary permissions, the password has not expired
- Verify that RLS policies or triggers are not prohibiting the operations
As there can be various reasons for this error, review the paragraphs in this chapter and please also visit our Knowledge Base to find the solution at: https://support.poweronbi.com
If you were not able to overcome your issue, please submit a ticket on our support site or write as at vizsupport@poweronbi.com and we will contact you shortly to help you investigate and fix the problem.
Debug
Diagnostic Mode
By default, Diagnostic Mode is disabled, so the whole content of Debug property group is disabled.
Turning it on reveals all of the debug settings. These settings are for debugging and developing purposes for developers in the first place.